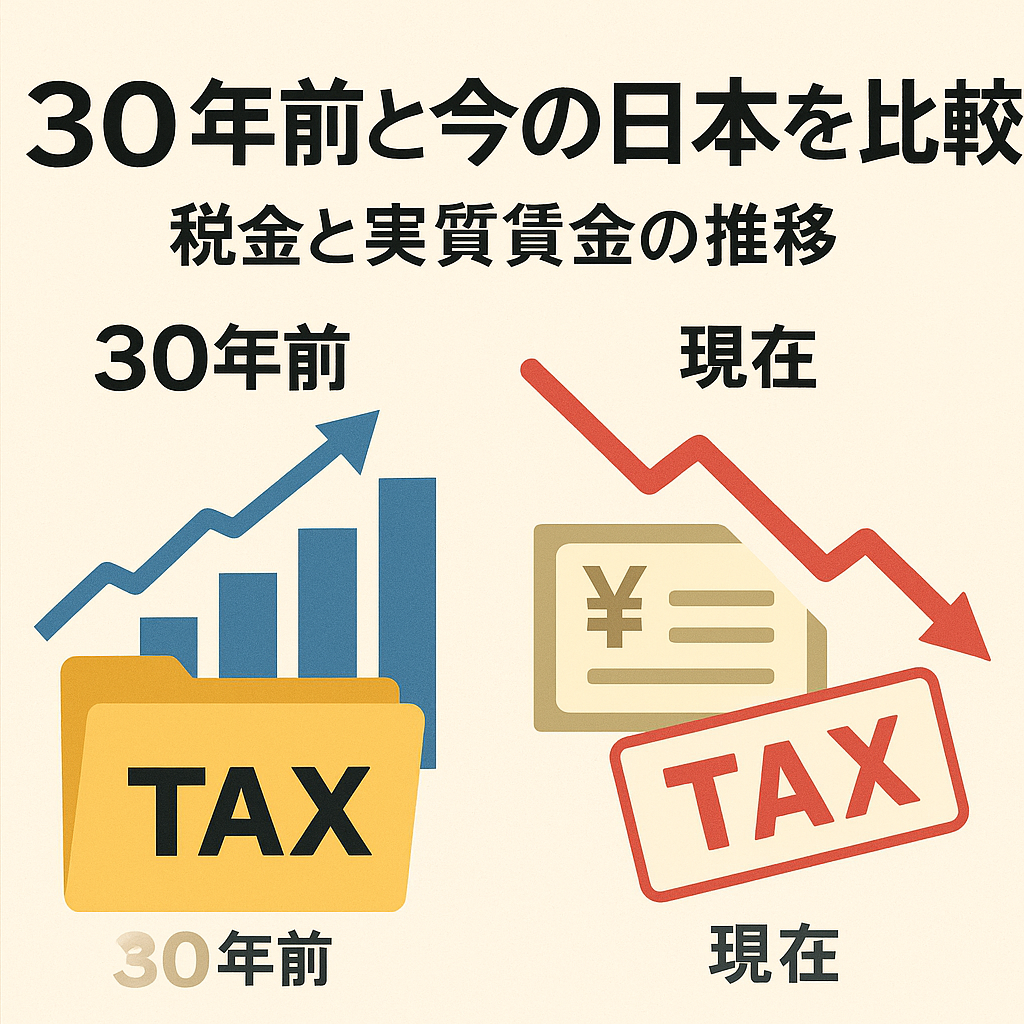
Japan Then and Now: A 30-Year Comparison of Real Wages and Taxes
- Introduction
- 1. Trends in Average Annual Income
- 2. Trends in Real Wages
- 3. Consumption Tax Increases
- 4. Income Tax and Social Insurance Contributions
- 5. Household Simulation for Business Professionals in Their 40s
- 6. Causes of Japan’s Economic Stagnation
- 7. What Business Professionals Should Do
- Conclusion
- Disclaimer
- Sources
Introduction
“Salaries don’t rise, but taxes and social insurance contributions keep increasing.”
If you are a business professional in your 40s, you may have felt this at some point.
In this article, we compare Japan in the early 1990s (about 30 years ago) and today, focusing on taxes and real wages. Using reliable statistics and charts, we will analyze how daily life has changed over time.
1. Trends in Average Annual Income
Let’s start by looking at income levels.
- Average income in 1990: 4.25 million yen
- Average income in 2023: 4.58 million yen
(Source: National Tax Agency, “Survey on Private Sector Salaries”)
At first glance, nominal wages seem to have increased slightly. However, given rising prices and heavier tax and social insurance burdens, the actual standard of living has not improved.

2. Trends in Real Wages
According to data from the Ministry of Health, Labour and Welfare (MHLW) and international organizations, Japan’s real wages peaked in 1997 and have been declining since.
- From 1995 to 2023, real wages fell by about 11% (Source: Wikipedia: Lost Decades)
- The IMF also notes that “real average wages in Japan were essentially flat from 1995 to 2021.”
So while nominal salaries may appear stable, purchasing power has clearly declined.

3. Consumption Tax Increases
Next, let’s review Japan’s consumption tax, which directly affects household budgets:
- 1989: Introduced at 3%
- 1997: Raised to 5%
- 2014: Raised to 8%
- 2019: Raised to 10%
(Source: Ministry of Finance, Japan)
For example, if a household with 5 million yen annual income spends 3 million yen per year:
- 1990 (tax rate 3%): about 90,000 yen
- 2023 (tax rate 10%): about 300,000 yen
The difference is more than 200,000 yen per year.

4. Income Tax and Social Insurance Contributions
Income Tax
In the 1980s–early 1990s, the highest marginal income tax rate exceeded 70%.
Subsequent reforms lowered it to 37%.
However, deductions were reduced and local resident taxes revised, meaning the middle class has faced increasing burdens.
Social Insurance
- Early 1990s: Pension contribution rate ≈ 14%
- 2023: 18.3% (split equally between employer and employee, ≈9.15% each)
(Source: Ministry of Health, Labour and Welfare)
Deductions from salaries have increased year by year, reducing disposable income.
5. Household Simulation for Business Professionals in Their 40s
Example: An employee earning 5 million yen per year.
- Around 1990
Gross income: 5 million yen
Income/resident taxes + social insurance: ≈0.8 million yen
Take-home pay: ≈4.2 million yen - 2023
Gross income: 5 million yen
Income/resident taxes + social insurance: ≈1.2 million yen
Take-home pay: ≈3.8 million yen
With higher consumption tax included, disposable income has shrunk significantly even at the same nominal salary level.
6. Causes of Japan’s Economic Stagnation
Over the past 30 years, key issues have emerged:
- Stagnant or falling wages
- Rising taxes and social insurance contributions
- Declining real living standards
Main factors include:
- Prolonged deflation (since the 1990s)
- Rising social security costs due to an aging population
- Weak productivity growth
- Declining global competitiveness
7. What Business Professionals Should Do
For those of us in our 40s, shrinking disposable income is a reality.
But there are steps we can take:
- Asset building (investment)
Utilize NISA or iDeCo accounts to develop income sources beyond salary. - Side jobs or multiple careers
Avoid relying on one employer; diversify your income streams. - Maximize tax benefits
Make use of deductions such as mortgage interest, insurance premiums, and hometown tax donations (Furusato Nozei). - Career development
Enhance skills and market value to improve earning potential even in a stagnant wage environment.
Conclusion
Compared to 30 years ago, Japan’s average annual income has nominally increased, but real wages have declined, and tax and social insurance burdens have grown.
For mid-career professionals, this means shrinking disposable income is the new normal.
By understanding reality and taking steps such as asset building and career development, we can expand our future options.
Instead of only lamenting the “Lost Decades,” let’s focus on how to survive and thrive in the next 30 years.
Disclaimer
While this article is based on reliable data sources, information may change due to updates or policy revisions. Figures are general statistics and do not guarantee individual outcomes. Please consult the latest official sources or professionals before making financial decisions.
Sources
- National Tax Agency: Survey on Private Sector Salaries
- Ministry of Health, Labour and Welfare: Monthly Labour Survey (Real Wages)
- Ministry of Health, Labour and Welfare: Pension Contribution Rates
- Wikipedia: Lost Decades
- Ministry of Finance: Consumption Tax
- IMF Reports


